
The title is a nod to The Pragmatic Programmer by David Thomas and Andrew Hunt. But it might also be a nod to the wagging tail of a purple and white terrier named Bits.
Our Current State
At FlightAware, we use two different observability platforms, our in-house monitoring architecture and DataDog. This is the story of how we got here, what we are doing and where we are going. FlightAware’s Systems team has built an in-house monitoring platform based on Prometheus, ElasticSearch for logs, PagerDuty for incident response and a collection of proprietary solutions touched on in a 2020 post.
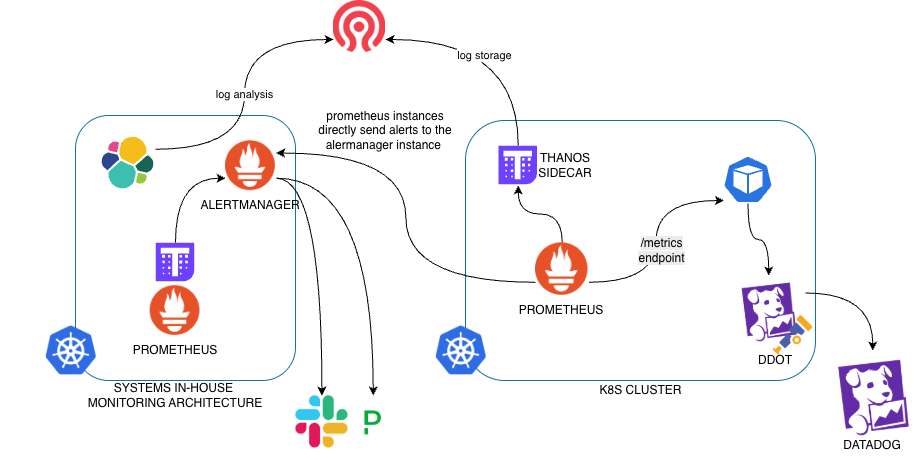
The in-house monitoring architecture has served FlightAware well. However, the Systems team is not the only stakeholder heavily invested in observability. Our software engineers are dedicated to ensuring reliability and performance of our distributed systems. To that aim, we are starting to leverage new tools needed to make DevOps tasks, such as observability, easier to manage.
In the diagram above, you may have noticed the DataDog logo in the bottom right corner. Since our modern stack is embracing cloud native architecture, developers need a way to view the full request distributed lifecycle, i.e. traces. A trace represents the entire flow of a transaction, composed of spans (individual service lifecycle). As part of its Application Performance Monitoring (APM), DataDog supports traces out of the box. We have instrumented all of our modern stack backend microservices with the DataDog Distribution of OpenTelemetry Collector (DDOT). Why did we choose the DDOT over the DataDog Agent? An OTel framework prevents vendor lock-in and keeps us tool agnostic. Libraries are available for all of our first class coding languages.
Why DataDog?
DataDog gives FlightAware developers a fully featured, managed monitoring architecture. Developers can catch issues earlier and debug problems easier. Features we use include:
- Custom service dashboards
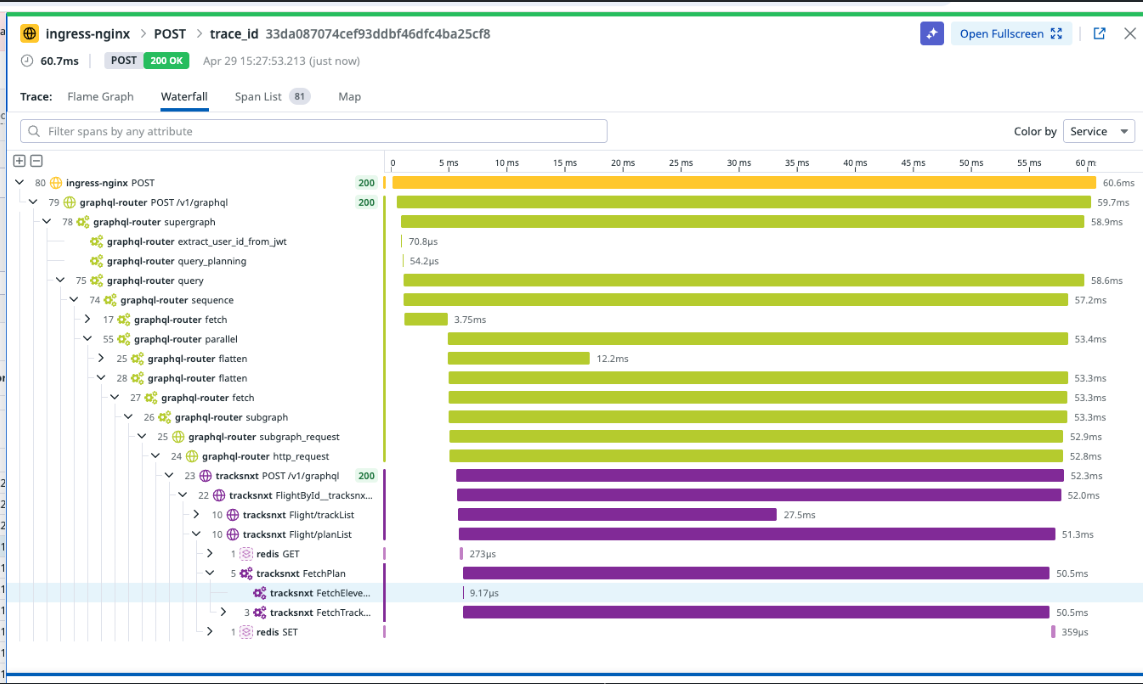
- Flame Graphs, Waterfalls, and Maps in Traces Explorer
- Algorithmic anomaly and predictive alerting
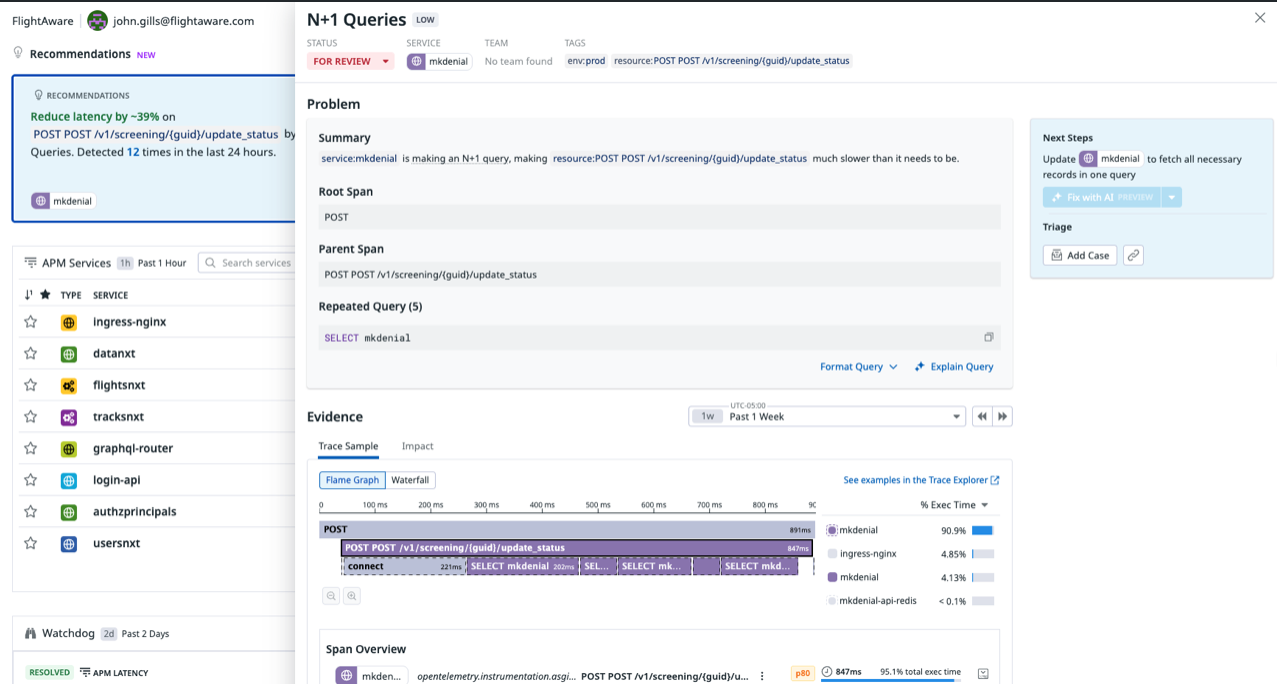
- Watchdog AI-powered Recommendations
Why not lock in on DataDog?
While DataDog has many benefits for FlightAware developers, the downside is the cost. It is very easy to run up your bill with logging, custom metric or span volume overages. Ensuring we don’t blow our budget requires vigilance. Thus, we are managing overages in the following ways:
- Limit DataDog usage to only backend services in our modern k8s stack.
- Use DataDog’s Anomaly Monitor to catch overages early.
- Logs: We either remove or set noisy logs to “debug” level.
- Custom Metrics: The key is low cardinality on the metrics. We identify high volume metrics via the Usage panel. Then, we use the Tag Cardinality Explorer on the Metrics Summary page to address tag spikes.
Handling span overages is a more complicated challenge. When faced with a budget on span ingestion, the answer is obvious: sampling. We don’t need to capture every trace. We are generally only interested in traces where there was latency or an error occurred. Optionally, we may want to keep around a small percentage of healthy traces just for baseline comparison.
The particular sampling strategy we are interested is tail-based sampling. With tail-based sampling, the decision to sample is made after the entire trace has been processed. This allows for complex rules, such as "always sample if the trace has an error" or "always sample if latency > 500ms".
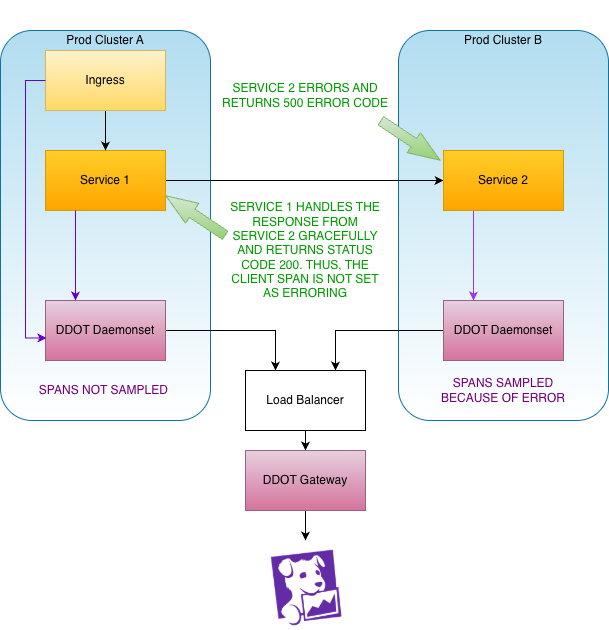
Here’s the challenge: because the decision to sample occurs on the DDOT DaemonSet on separate clusters, if the error or latency in the request only occurs on a single cluster, spans on other clusters won’t be sampled and the trace will be incomplete.
Future State
A potential solution to implement tail-based sampling without generating incomplete traces is a trace ID aware loadbalancer. As of April 2026, DataDog promoted their DDOT gateway from Preview to General Availability. In this architecture, the sampling decision is made at the gateway allowing us to only sample traces we want and avoid incomplete traces. See the diagram below.
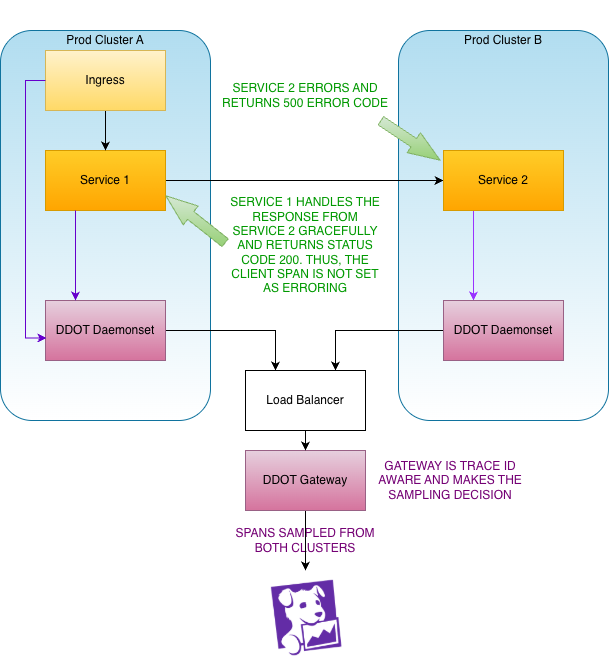
The tail-based sampling solution is currently in architectural review. Until next time. Keep wagging your tail and happy monitoring!