

Marissa Konicke is a Product Manager for FlightAware’s B2B and B2C SaaS applications. She has a strong focus on using data to drive every decision and eliminating end users’ pain points.
A Product Manager’s job is to answer the ‘why’ for every ticket. Engineers may know what needs to get done, or how to do it, but do they know why they’re doing it? Why they’re building a new signup journey? Why they’re fixing a bug that’s been around for years? Why they’re spending so much time researching how to optimize maps? Without a ‘why,’ we have no purpose. No objective to reach. So, how do you find the ‘why?’
At FlightAware, we have over one thousand tickets in the Web team’s backlog and counting. This is extremely overwhelming to any new Product Manager trying to figure out what to prioritize next. Do we prioritize the bugs reported by the Executive team (who happen to be vigilant users of our platform)? The feature requests from the Customer Support team? The product improvements from the Sales team? Or the constant asks from our users? Figuring out what to prioritize is very similar to figuring out our ‘why.’ That is where data analytics helps to steer us in the right direction.
Data Analytics and Prioritization
Using data to drive every decision allows us to eliminate any biases, focus on our objectives, maintain competitiveness, keep the user top of mind, and ultimately make better decisions for the business’ success. Our team is constantly monitoring analytics across our website and mobile apps. We look at monthly active users, conversion rate, feature engagement, and top pages/screens visited. With over eight million users using our platforms every month, in addition to having multiple software releases a day, it's crucial to our success to constantly pay attention to these metrics. Data analytics allow us to understand our users’ activity, how they’re engaging with our site, what they’re interested in, how feature releases impact user behavior, and where they’re spending the most time. Without this data, we would only see a tiny fraction of the picture of who our users are and what they’re doing, which could cause us to make the wrong decisions and negatively impact our business’ performance.
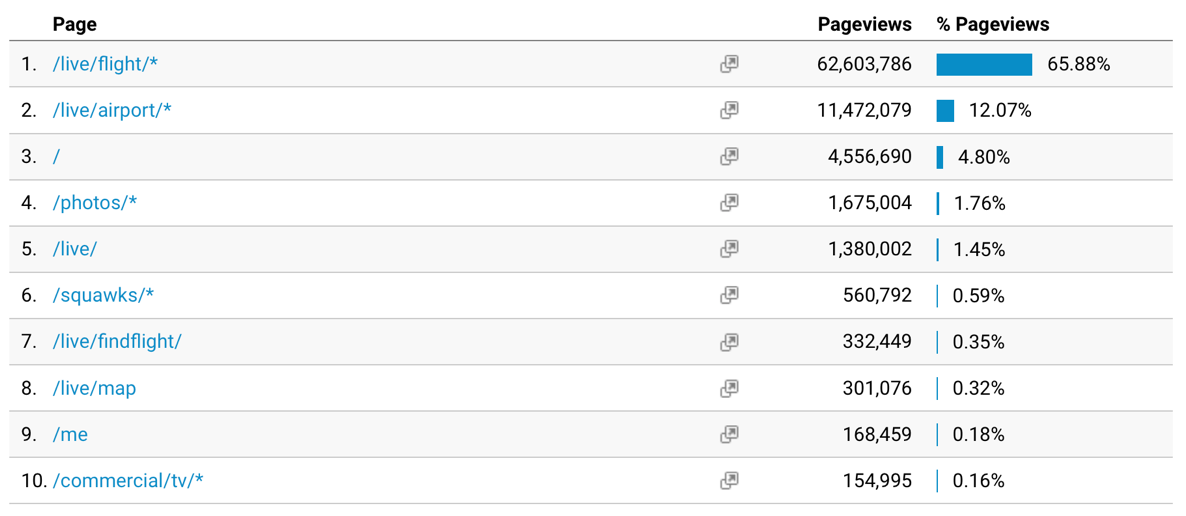
Accompanying data analytics, defined business or product goals help significantly with making better decisions. Whether you are trying to grow revenue, decrease cost, raise your product’s NPS or customer satisfaction score, reduce churn, or double your user base, having a ‘North Star’ objective defined early on will help you align your priorities. When you know what you’re trying to achieve, the data will help you navigate to your ‘North Star.’ Right now, FlightAware is primarily focused on growing revenue, and our ‘North Star’ objective is to double our revenue by 2022. We’re using user and market data to find segments of the market that are actively using our platforms, but that we aren’t monetizing. In addition, we are identifying highly trafficked pages to target our product upsell messaging to further entice engaged users at key points in their journey to purchase one of our subscriptions.
Transforming Data into Meaningful Change
At FlightAware, we also keep a close eye on metrics after big releases, such as launching a new feature or product. We measure the success of the feature or product release based on a set of Key Performance Indicators, or KPIs, established before the release. Following these metrics, we can see if the release is achieving what we wanted it to. Were our assumptions and hypotheses correct? Did this change actually lead to an increase in conversion? The whole purpose of being agile is to allow room for adjustment – allowing us to change the direction we’re heading by either adjusting to market changes or our users’ behavior. Constantly monitoring our data analytics allows us to make decisions to continuously iterate on our platforms in a way that creates meaningful change.

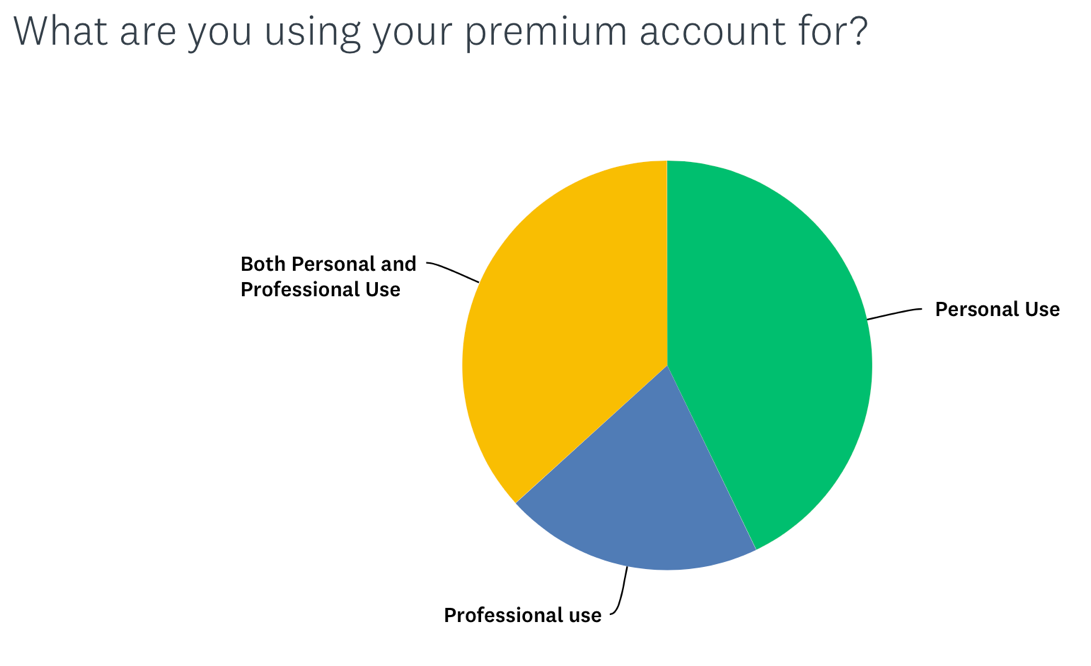
In addition to monitoring our website and mobile apps analytics, we utilize user surveys, user interviews, and user testing to capture both quantitative and qualitative data on our customers. Capturing this feedback is crucial to understanding our users and the market. Gathering all of these pieces of data helps us paint a larger picture of our users and their needs and pain points. Being focused on data allows us to understand our customers better and improve the user experience in ways that matter the most. This eliminates the ‘shot in the dark’ guessing mentality, biased opinions, and feelings. Having so much that needs to get done, we want to maximize the positive impact we have on our users and our business with each item we choose to do.
Understanding our users better using data helps us define our ‘why’ by allowing us to make data-driven decisions that better set us up for success at achieving our ‘North Star’ Objective and Key Results (OKRs). Recently, FlightAware rebuilt one of our product’s online signup journeys. We needed to double our self-signup conversion (one of our Key Results), and the data was telling us that users were tending to contact our Sales team rather than signing up themselves. Using our gathered information, we identified ways to optimize the online signup journey. Using data from user surveys, we included better messaging of customers’ top-rated features and benefits of the product. Using user engagement data, we redesigned the UI to allow users to easily self-serve and see all of the information they needed to make a purchase decision independently. So why did we rebuild the online signup journey? To increase the number of users who could make a purchase decision without having to contact our Sales team. And why did we do that? To increase conversion, which ultimately led to increased revenue, getting us closer to our ‘North Star’ objective.
Understanding your users and how they interact with your product using data analytics will help ensure you maximize the impact you’re making, not only on your user experience but on your OKRs as well. Being a Product Manager is all about making decisions – what’s important to work on and what can wait, what is going to have the most impact to your OKRs, and therefore, help prioritize your backlog of an overwhelming number of tickets. Understanding and analyzing this data, along with having defined business and product OKRs is how FlightAware’s Product team optimizes our data-decision-making and answers the question of ‘why.’
- AppFollow (mobile apps)
- App Store Connect (iOS mobile app)
- Crazy Egg (website heatmaps)
- Google Analytics (website and mobile apps)
- Google Play Console (Android mobile app)
- Google Search Console (website SEO)
- Jupyter Notebooks (data analysis)
- Microsoft App Center (mobile apps)
- Postico (database SQL querying)
- SEMrush (website SEO)
- SurveyMonkey (user feedback)