

As a Software Engineer 2 for the Flight Tracking crew, Yuki Saito is responsible for the performance, reliability, and observability of multi-machine Hyperfeed.
Abstract
HyperFeed® (HF) is FlightAware’s core flight data processing engine that empowers worldwide flight tracking for our customers. Redeye is an internal service at FlightAware that allows developers to run regression tests for HyperFeed in AWS. Running regression tests is critical in ensuring that code changes made to HyperFeed do not break previously working functionality. Historically, regression tests ran on a single machine on-prem using a program called hf_regression_tests. As the number of tests and the number of users increased, a need arose to move our testing infrastructure from on-prem to the cloud. A significant effort was then undertaken to support the initiative throughout 2020.
This post introduces our historical hf_regression_tests, describes the motivation for migration to the cloud, provides high-level, dynamic views of Redeye, and discusses the pros and cons of Redeye. This post assumes familiarity with some basic concepts in AWS, Kubernetes, and Argo.
What Is hf_regression_tests?
HyperFeed is responsible for ingesting all FlightAware’s 40+ data feeds, aggregating the data together, resolving inconsistencies, filling in gaps, detecting and filtering out unreliable or bad data, and producing a single data feed that represents an all-encompassing, coherent view of worldwide flight traffic as understood by FlightAware[1]. Viewed as a black box, HyperFeed is one large function with side effects. It takes various data feeds as input and produces the canonical consolidated feed as output. While doing so, it causes side effects to PostgreSQL to manage the states of flights being tracked.
Once tasked with creating an infrastructure for testing the functionality of HyperFeed, we developed hf_regression_tests. This was meant to run on a single machine on-prem. To describe how it works, we show hf_regression_tests in action in Figure 1:
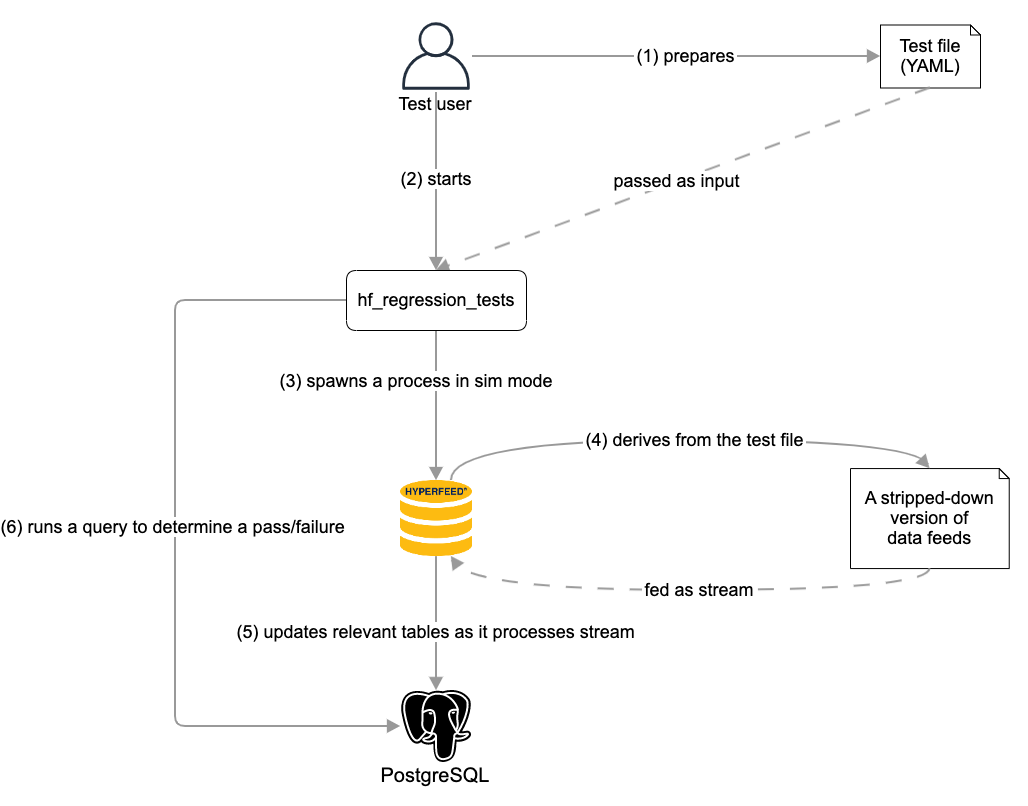
A sequence of steps is carried out as follows:
- The test user prepares a test file in the YAML format. The file contains two primary pieces of information: the predefined description of a flight under test and SQL queries to run against PostgreSQL for verifying the states of the flight.
- The test user starts running hf_regression_tests, passing the test file among other inputs.
- hf_regression_tests spawns a HyperFeed process in simulation (sim) mode.
- Running in sim mode, HyperFeed generates a stripped-down version of data feeds based on the predefined description of the flight in the test file. This ensures that HyperFeed only needs to process a subset of data feeds relevant to the given test, reducing the total execution time. This derived file may be stored on a disk at a designated location so that the next time the same test runs, HyperFeed in sim mode does not need to regenerate the same file again.
- HyperFeed processes the stripped-down version of data feeds in a streaming fashion. As it handles each data feed line, it updates the relevant tables in PostgreSQL such as "flightplans.
- After the HyperFeed process has exited, hf_regression_tests runs the SQL queries described in the test file against PostgreSQL to determine a pass/failure for the test.
The steps above describe how hf_regression_tests processes a single test file. In the case of processing multiple test files as input, it spawns a HyperFeed process per file. hf_regression_tests ensures that the maximum number of tests being processed is 30 at any point, with each assigned its own schema in PostgreSQL so their schemas were isolated from one another.
Growing Pains for hf_regression_tests
Now that we have seen how hf_regression_tests works, let us talk about its pain points.
The first pain point was the growing turnaround time for a run of hf_regression_tests. As of writing, we have about 400 test files, each containing multiple test cases. On average it takes a single run approximately 45 minutes to finish all tests. We could have increased the maximum number of tests being processed simultaneously, but we feared that this architecture might not keep up with the ever-increasing number of tests in the future.
The second pain point was that only one user at a time could run hf_regression_tests in our Jenkins pipeline. We have Jenkins integrated into our GitHub repository for HyperFeed, and every pull request (PR) must run this pipeline and pass all tests for it to be qualified as “ready to merge.” In this model, Jenkins will deploy code changes being verified to a shared location on a designated machine on-prem before it runs hf_regression_tests. This means that the second user wishing to run it via Jenkins would have to wait for the first user to finish, which could take up to the full duration of the tests in the worst case. The issue was less painful when the number of users was limited, but we knew that this would not continue to be the case as more people were added to the team.
Moving Testing Infrastructure to Cloud
To address the pain points of hf_regression_tests, we considered migrating our testing environment from on-prem to the cloud. The Predictive Technology crew had tremendous success in using Argo running in Elastic Kubernetes Service (EKS) to train predictive models. Therefore, it made sense to adopt a similar technology stack for developing our testing infrastructure in the cloud. We were reasonably confident that Cluster Autoscaler in AWS would ensure that it automatically provisioned additional machines based on the number of tests running simultaneously. Furthermore, Argo was a perfect fit for managing the testing workflow we had envisioned where we wished to execute all tests in parallel and aggregate their results at the end.
Apart from executing tests in the cloud, there were more caveats to consider for this new testing service in the cloud. While it was meant to largely replace the existing hf_regression_tests, we wanted to minimize the impact on users’ day-to-day workflow as much as possible. Specifically, users would interact with GitHub and Jenkins as a façade to trigger runs of hf_regression_tests. It was crucial that they would be able to continue using the same façade to interact with our new testing service in the cloud.
Next, we will navigate through a high-level view of Redeye and see how the pieces we laid out in AWS met the requirements above.
Redeye from a Rube Goldberg Machine’s Perspective
In this section, we will be looking at several diagrams, each focusing on a particular scenario during the execution of Redeye. The goal here is to understand the behavior of Redeye at a high level from a Rube Goldberg machine’s perspective.
Redeye infrastructure
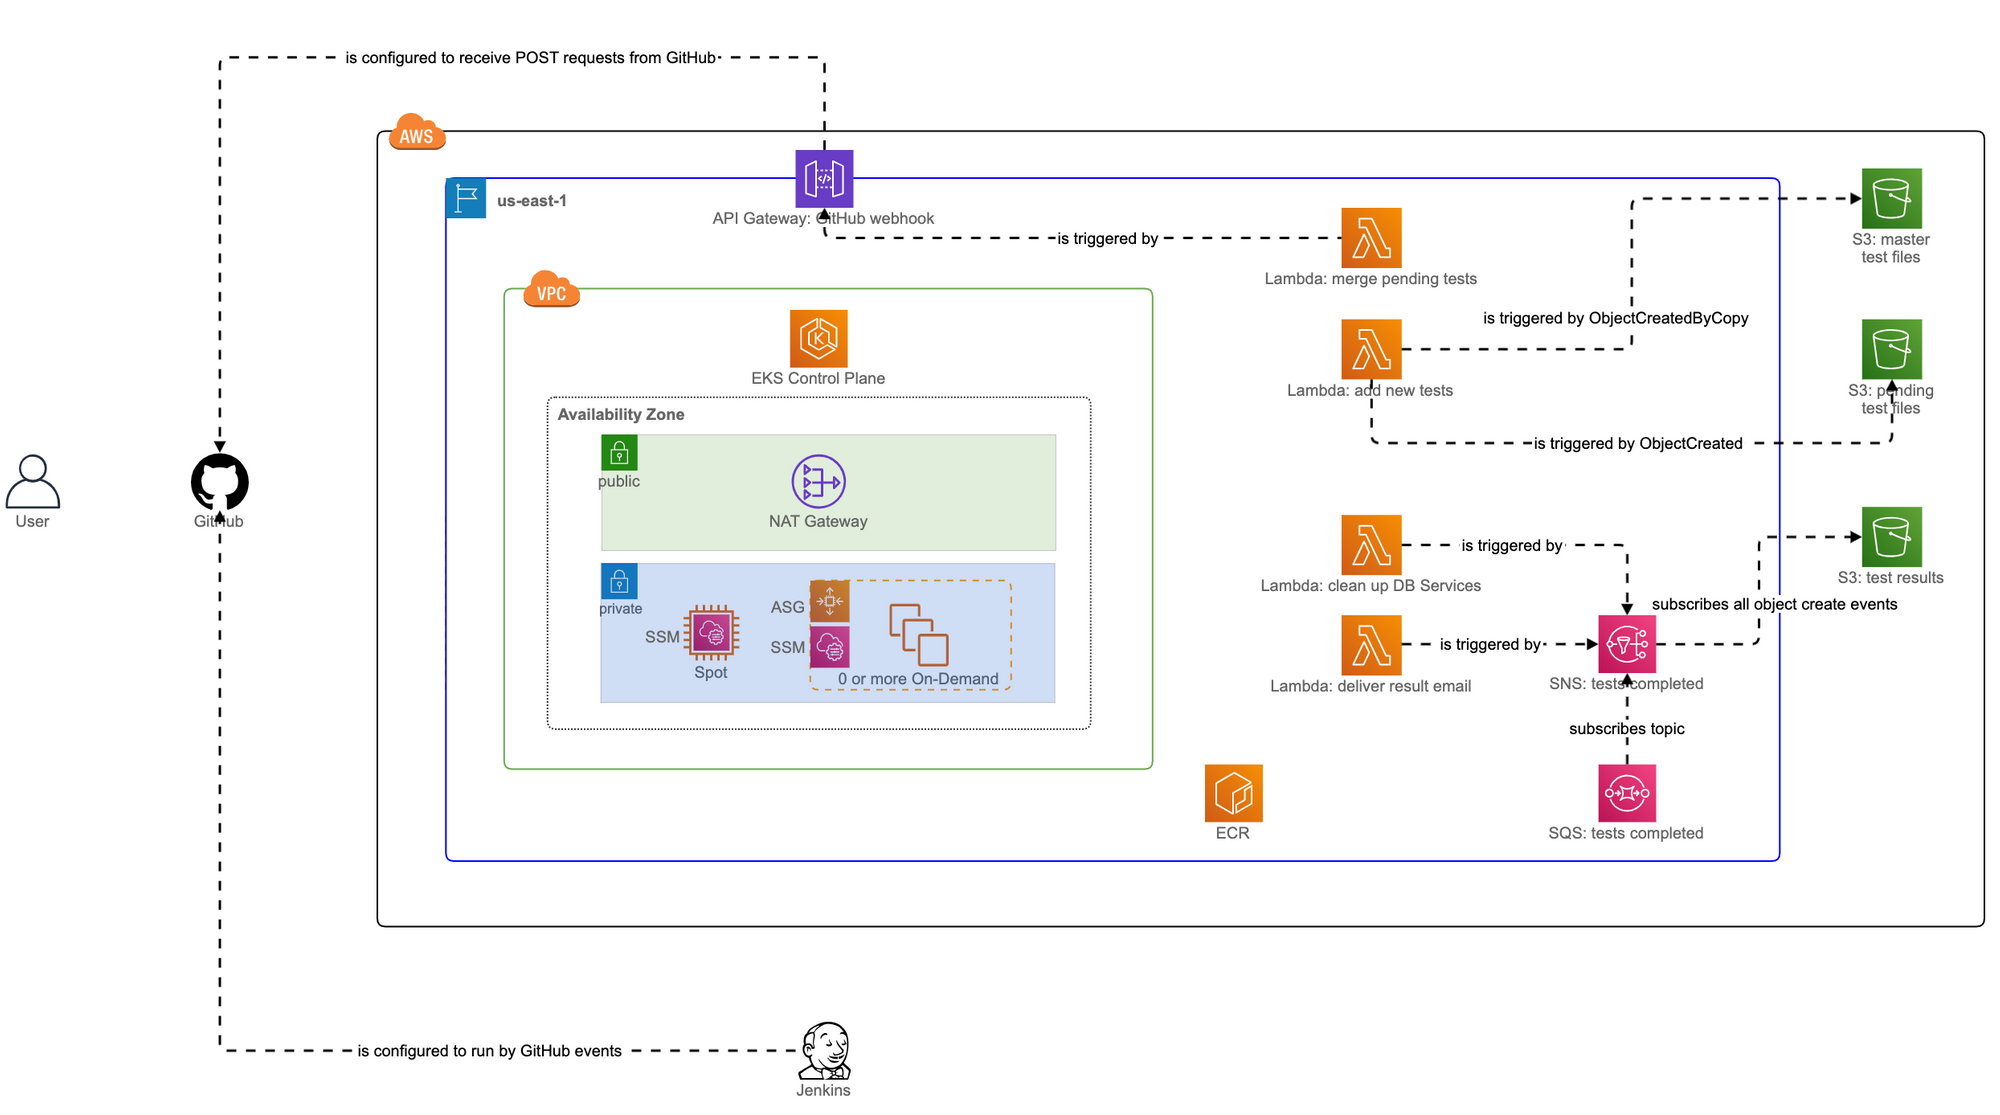
Figure 2 shows how various services for Redeye are laid out in AWS and how the user can indirectly interact with them through GitHub and Jenkins. Everything outside the AWS box (depicted as a solid rectangle in black) is considered “things operating at FlightAware.”
Figure 2 also shows dotted arrows between services. Each dotted arrow indicates how one service (from which the line is originating) is configured to run in response to some events from another service (to which the arrowhead is pointing). This means that actual data flow at runtime between two services is in the reverse direction of the dotted arrow connecting them (if a dotted arrow goes from service A to service B, data flows from service B to service A at runtime). These configurations are persisted and do not change each time an EKS cluster is provisioned (which is in the VPC box depicted as a solid rectangle in green).
An EKS cluster, on the other hand, is not persisted. It is set up at the beginning of each business day and torn down at the end of the day. This is because we want to save our AWS cost by not keeping around the cluster during hours when no one is using it. Cluster setup and teardown are managed by Terraform and we have a cron job that runs “terraform apply” and “terraform destroy” at specified times.
Furthermore, we maintain two auto scaling groups in the EKS cluster that together manage the execution of regression tests by automatically adjusting the number of EC2 instances depending on how many tests are running simultaneously.
- Test files: stored in the “master tests” S3 bucket and in the “pending tests” S3 bucket
- Stripped-down data feeds: stored in the “master tests” S3 bucket and in the “pending tests” S3 bucket
- HyperFeed: stored as a Docker image in Elastic Container Registry (ECR)
- PostgreSQL: stored as a Docker image in ECR
When a new EC2 instance is provisioned, either at the initial setup of an EKS cluster or by Cluster Autoscaler during the execution of regression tests, it runs a user data script to download the test files and stripped-down data feeds from both of the “master tests” S3 bucket and the “pending tests” S3 bucket to a local directory. This ensures that every EC2 instance in the EKS cluster has the same set of test files and stripped-down data feeds locally.
We have just scratched the surface of the architecture of Redeye but glancing over how pieces are laid out statically is merely one way to understand the whole infrastructure. Just like one could better understand a Rube Goldberg machine when it is in action, we should see Redeye in action, focusing on one execution scenario at a time.
Scenario 1 - Triggering a run of Redeye
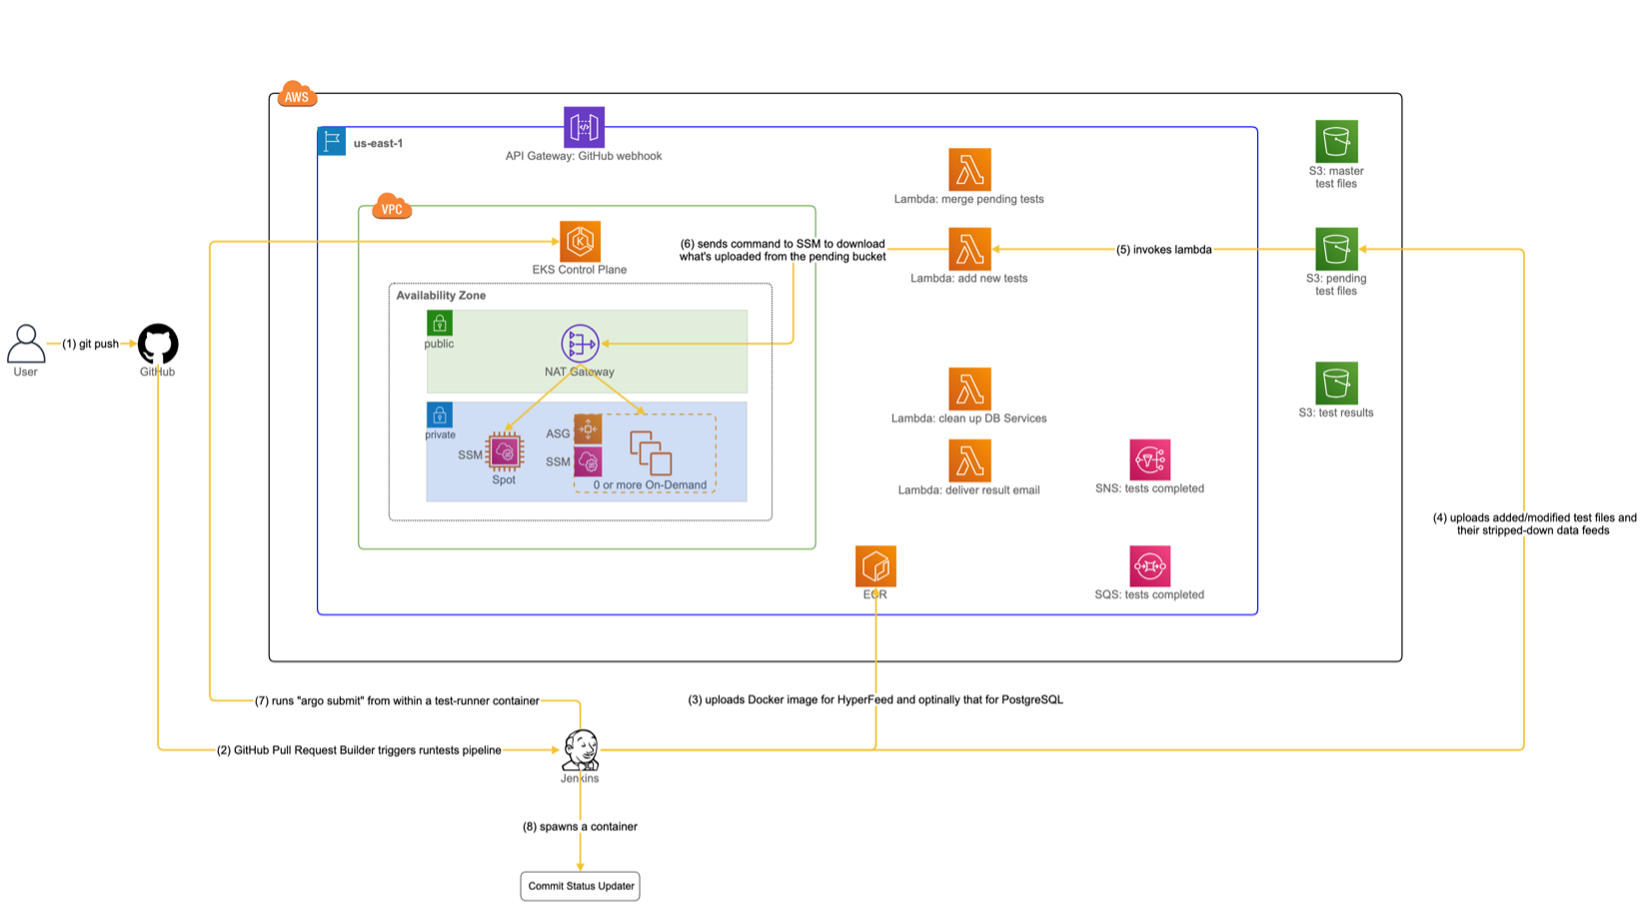
Figure 3 shows a sequence of actions (depicted by solid arrows in yellow) initiated by the user and leading up to a point where an Argo workflow for regression tests is submitted to EKS.
Let us go through the sequence one step at a time:
- The user opens a PR for a feature branch or “git push” new commits to the PR. This was how the user would also run hf_regression_tests on-prem through Jenkins, so the user’s workflow is unchanged for interfacing with Jenkins.
- The GitHub Pull Request Builder plugin reacts to a PR event and causes Jenkins to run the “regression tests” pipeline.
- The execution of the pipeline runs “docker build” to create a new Docker image for HyperFeed containing code changes in the feature branch. It then uploads the resulting image to ECR so that EKS can later fetch it while running the regression tests. Optionally, if the changed files in the PR include a schema update to PostgreSQL, the pipeline execution also builds an updated Docker image for PostgreSQL and uploads it to ECR.
- The execution of the pipeline inspects the changed files in the PR, looking for added/modified/deleted test YAML files. For added/modified ones, it derives stripped-down data feeds if necessary and uploads them along with the test files to the “pending tests” S3 bucket. For deleted ones, it does not immediately remove them from the “master tests” S3 bucket because other users on different branches may still need to run them for their regression tests. Instead, the pipeline execution treats them as filtered-out and later passes their test names to an “argo submit” command (which will be issued at step 7), so they are excluded from a list of tests to run.
- A lambda “add new tests” is triggered in response to an “ObjectCreated” event due to added/modified test files and stripped-down data feeds in the pending tests S3 bucket.
- The lambda sends a Systems Manager (SSM) command to all EC2 instances in EKS. Each EC2 instance then executes the command to download test files and stripped-down data feeds from the pending tests S3 bucket to a local directory unique to the feature branch.
- The execution of the pipeline runs a Docker container called “test-runner” that knows how to update the kubeconfig file to point to a currently active EKS cluster and issues “argo submit” to EKS to start running our testing workflow using Argo.
- The execution of the pipeline runs a Docker container called Commit Status Updater. This container will repeatedly poll for a message in Simple Queue Service (SQS) indicating the completion of the test run started at the previous step. Upon finding the target message in SQS, the container updates a GitHub build status icon for the PR depending on the result of the test run (see this for an example of GitHub build status icon). The reason we created Commit Status Updater was that hidden behind the company’s firewall, an endpoint for updating the GitHub build status icon could only be accessed by programs running within our company firewall.
We have gone through a series of event triggers, which started with the user’s “git push” and resulted in the launch of the Argo workflow managing the execution of regression tests. In the next scenario, we will be briefly looking at the execution of the workflow.
Scenario 2 - Executing regression tests workflow using Argo
For those who are not familiar with Argo, we highly suggest checking out our previous post Using Argo to Train Predictive Models since we are not going to provide an overview of Argo here. Instead, we will be talking about the topology of our Argo workflow specific to Redeye. The following Figure 4 shows an instance of the workflow topology, which is a snapshot of our testing workflow spawned by “argo submit” in the previous scenario.
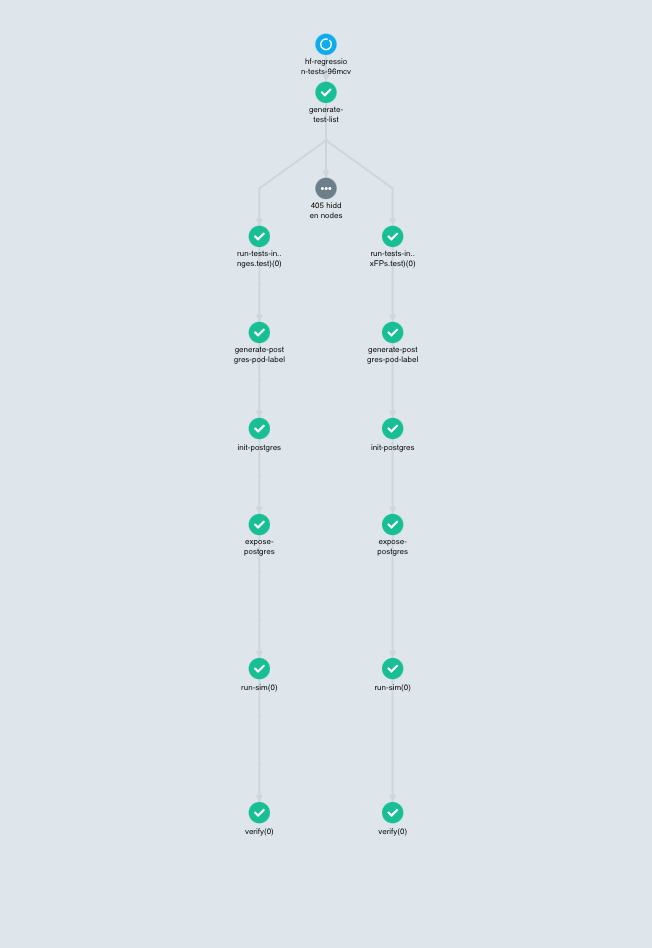
The figure shows a Directed Acyclic Graph (DAG) that forms a fan-out and fan-in topology (although the fan-in part is not shown because it will kick in when all tests have finished running). The fan-out part starts at the top of the figure that enumerates a list of all tests to run and branches off to 6-step vertical branches. Each branch represents running a single test file, which corresponds roughly to what we saw in Figure 1 but performs different steps specific to this Argo workflow. The first node in the branch, which is step 0, is a no-op and simply a marker step indicating which test file to process.
The remaining steps comprise the following:
- generate-postgres-pod-label: This step is responsible for generating a unique label given to a PosgreSQL pod that will be created at the next step.
- init-postgres: This step creates a PostgreSQL pod by pulling its Docker image stored in ECR. The pod created is given the unique label from the previous step so that it can be uniquely identified by that label by a Service that will be created at the next step.
- expose-postgres: This step creates a Service for the PostgreSQL pod and exposes its cluster IP. This ensures that a HyperFeed pod can locate its “buddy” database to which it writes through the Service. The unique label is important because the Service is guaranteed to expose one and only one buddy PostgreSQL pod for the HyperFeed pod; without the unique label, the Service could expose a different PostgreSQL pod used by another HyperFeed pod, and two HyperFeed pods would then write to the same PostgreSQL pod. It is worth mentioning that Argo does not provide a direct way of creating Services by itself but does provide Kubernetes Resources that allow us to embed a Kubernetes manifest within an Argo step. Lastly, the PostgreSQL Service itself is given a label (derived from the name of the current workflow) that is shared by other PostgreSQL Services within the same workflow.
- run-sim: This step pulls a Docker image for HyperFeed and creates a HyperFeed pod. The test file and its corresponding stripped-down data feeds that the pod needs should have been downloaded to whatever host on which it is assigned. The HyperFeed pod then behaves in much the same way as the HyperFeed process we saw in Figure 1.
- verify: The final step, just like step 6 in Figure 1, runs the SQL queries described in the test file against the PostgreSQL pod to determine a pass/failure for the test.
Note that there is an ellipsis in a grey circle in Figure 4 that hides 405 more vertical branches. This means Argo performs the above steps for all 407 tests in parallel (fan-out), and when they have finished it collects individual results to determine the ultimate pass/failure for the workflow (fan-in). Using Cluster Autoscaler, Argo makes sure that enough EC2 instances are provisioned during the execution of the tests so that every pod can be scheduled onto some EC2 instance and make progress.
We have touched upon how Argo manages the execution of our testing workflow. Once the pass/failure of the workflow is determined, we need to deliver it to the user. The next scenario illustrates how we can achieve it.
Scenario 3 - Delivering result to the user
The use case we will now be looking at is to report the result of all tests back to the user. This means two things: one is to let the user know the result, and the other is to update the GitHub build status icon accordingly. The following Figure 5, taking us back to the AWS diagram, shows a sequence of actions that achieves those goals.
Before we move on, we need to clarify some notations used in Figure 5. Steps starting with a numeric value followed by an alphabet such as 3a, 3b, and 3c mean that they execute in parallel with no specific orderings between them. Furthermore, a step with a larger numeric value but with the same alphabet means that it executes sequentially after the previous step with a smaller numeric value with that alphabet. For instance, step 4a runs after step 3a but there are no specific orderings with respect to 3b or 3c.
With that, let us continue our journey through the Rube Goldberg machine in Figure 5, on its way back to the user.
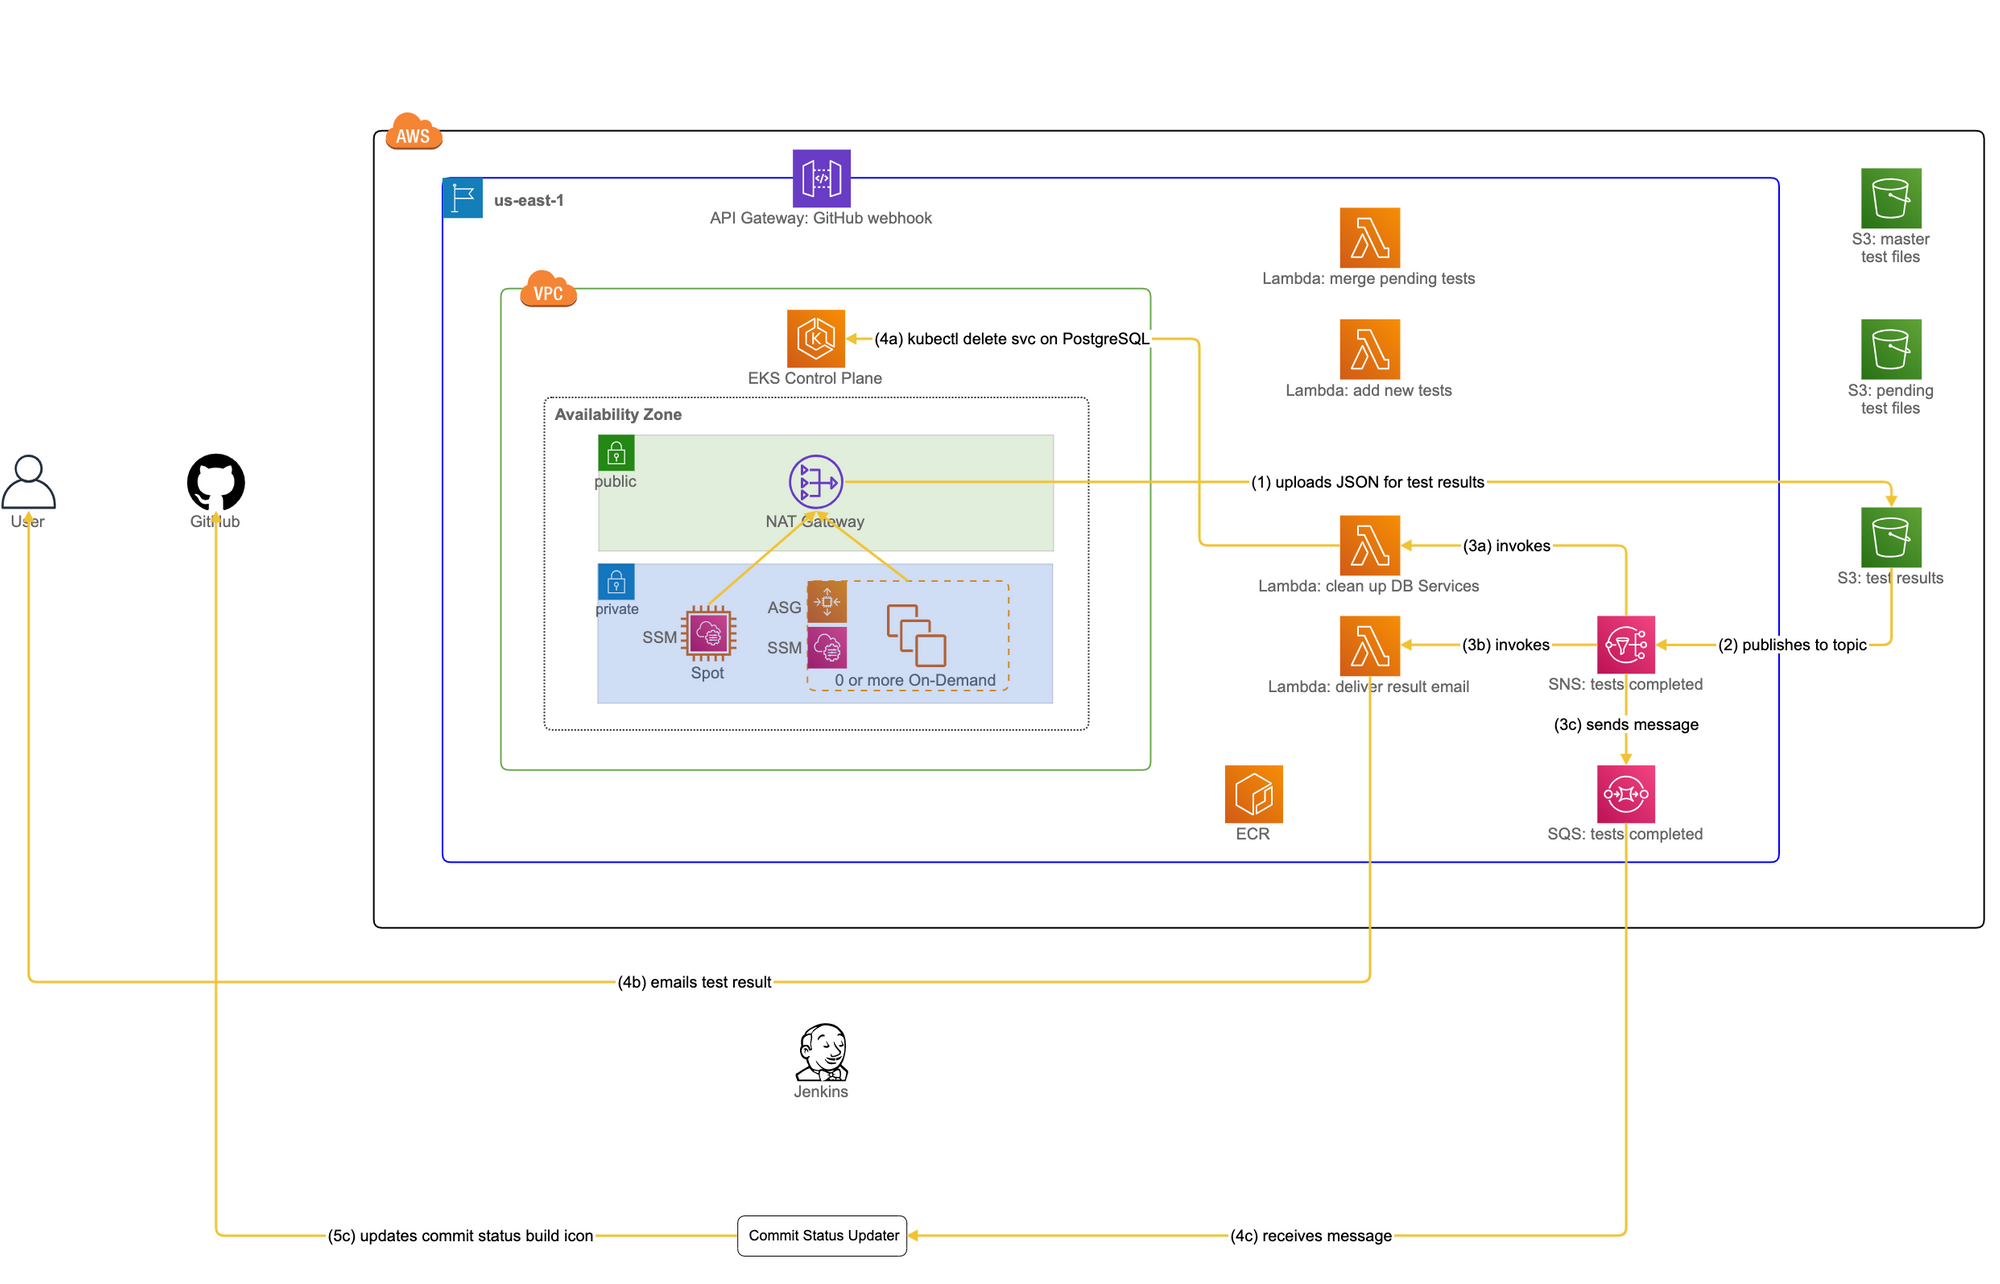
- 1. When Argo has completed the testing workflow, it uploads the result (in JSON) to the “test results” S3 bucket. The JSON has the name of the user in its filename and it will be used at step 3b.
- 2. In response to an “ObjectCreated” event triggered by the result JSON uploaded, the “test results” S3 bucket sends a notification to a topic in the “tests completed” Simple Notification Service (SNS). The reason for the use of SNS is that S3 only supports sending notifications to a single target (at least at the time of development). If multiple lambdas are interested in such notifications, we need to have some mediator between S3 and lambdas to fan-out the notifications to them.
- 3a. This is one branch of the execution triggered by the “tests completed” SNS. It invokes a lambda “clean up DB Services.” Why do we need to clean up Services for PostgreSQL? Recall that Argo created those Services using the Kubernetes Resource constructs. Their lifecycle is managed by Kubernetes itself rather than Argo and because of that, it is not up to Argo to clean them up when it has completed the testing workflow, but rather it is up to us to ensure that those resources are deleted properly.
- 4a. The lambda issues the equivalent of “kubectl delete svc” to EKS, using the Kubernetes API in Python, to delete PostgreSQL Services. In the EKS cluster, there may be other PostgreSQL Services that belong to a different workflow owned by another user. How do we know which of them to delete? Recall from the step “expose-postgres” in the previous scenario that all PostgreSQL Services share the same label. This label is derived from the name of a workflow, and it is available in a parameter passed to the lambda. The lambda can then construct the label on-the-fly and pass it to “kubectl delete svc,” deleting PostgreSQL Services whose labels match the target one.
- 3b. In another branch of the execution triggered by SNS at step 2, a lambda “deliver result email” is invoked. Using the username embedded in the filename of the JSON, the lambda uses Simple Email Service (SES) to deliver the pass/failure to the user.
- 4b. SES delivers the test result to the user.
- 3c. In the last branch of the execution triggered by SNS at step 2, SNS sends a message to the “tests completed” SQS.
- 4c. The Commit Status Updater container has been polling for the message. Once it has found the message from step 3c, the container retrieves it and deletes it from SQS.
- 5c. The Commit Status Updater container checks the contents of the retrieved message and obtains the result of the test run. It then sends a POST request to our GitHub endpoint to update the build status icon in the PR accordingly and terminates the container itself.
At this point, the user who initiated the run of Redeye has received the email containing the pass/failure, and the build status icon in the PR has been updated to display the result.
If code changes from the feature branch did not pass all tests, the user needs to address the test failures and re-run Redeye. Rinse and repeat until the code changes pass all tests. When they do, the user is finally able to merge the PR to the developers’ shared branch.
It turns out that there is some additional housekeeping that needs to be done when a PR is merged into the developers’ shared branch, which we will be looking at in the next scenario.
Scenario 4 - Merging feature branch to developers’ shared branch
The use case discussed in this scenario is to merge a feature branch that has been qualified to be merged into the developers' shared branch. This gives our Rube Goldberg machine the final nudge to complete its journey. In essence, we ensure that what has been merged to the shared branch will be visible to other users of Redeye. With that in mind, let us trace through Figure 6 (the notations we explained for Figure 5 also apply here).
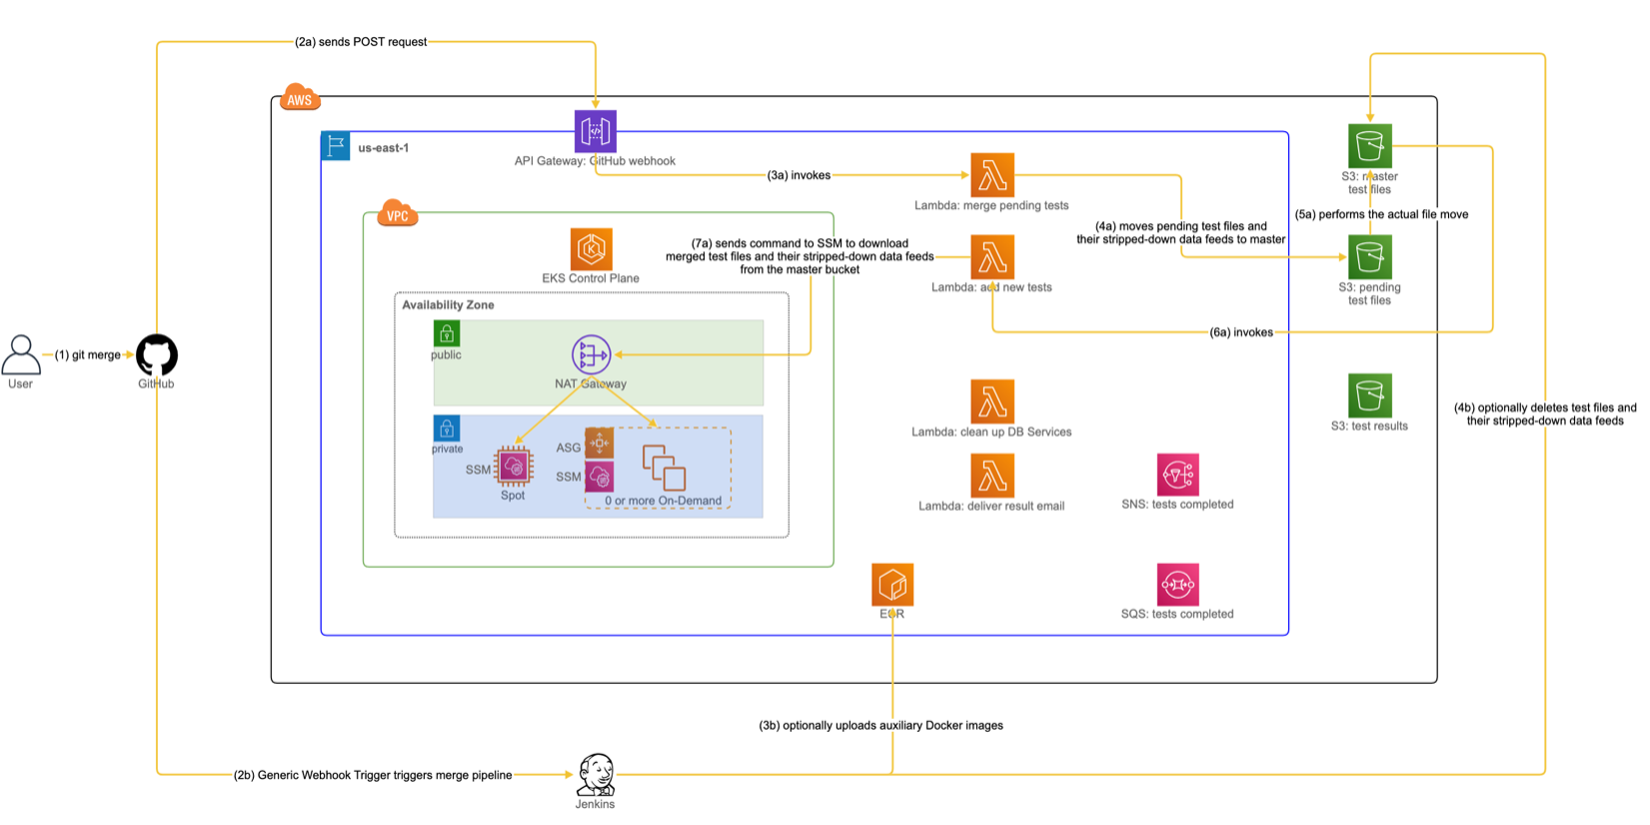
- 1. The user merges the feature branch to the developers’ shared branch.
- 2a. In response to a GitHub PR event, one of the GitHub Webhooks is triggered to send a POST request to an endpoint defined by API Gateway.
- 3a. The API Gateway triggers a lambda “merge pending tests.”
- 4a. The lambda inspects an incoming payload to determine whether it should proceed with further processing. In particular, the lambda checks for two conditions about the payload: whether it is “git merge” and “merged to the shared branch.” If the payload satisfies both conditions, the lambda executes a command to move added/modified test files and their stripped-down data feeds from the “pending tests” S3 bucket to the “master tests” S3 bucket.
- 5a. The added/modified test files and their stripped-down data feeds are moved from the "pending tests" S3 bucket to the "master tests" S3 bucket.
- 6a. In response to an “ObjectCreatedByCopy” event in the “master tests” S3 bucket, the lambda “add new tests” is triggered.
- 7a. Like step 6 in Figure 3, the lambda sends an SSM command to all EC2 instances in EKS. This time, each instance executes the command to download the moved test files from the “master tests” S3 bucket to a local directory visible to all test users.
- 2b. Another GitHub Webhook is triggered to send a POST request to Jenkins via the Generic Webhook Trigger plugin, which runs the “merge” pipeline. The plugin performs a sanity check similar to what is performed at step 4a. Specifically, it checks whether the POST request represents “git merge” and “merged to the shared branch.” If so, it proceeds with subsequent steps.
- 3b. The execution of the pipeline optionally builds and uploads auxiliary Docker images to ECR. Whether auxiliary images need to be uploaded depends on the changed files that have been merged to the shared branch. Auxiliary images include a base Docker image for a HyperFeed image (as used by its multi-stage build) or an updated PostgreSQL image if merged files contain a schema change.
- 4b. If merged files include deleted test files, the execution of the pipeline will remove them and their stripped-down data feeds from the “master tests” S3 bucket.
After we have gone through the above steps, the code changes from the feature branch have been merged to the shared branch, and the required updates have been reflected to our testing infrastructure. That way, the states of Redeye will be in sync with our GitHub repository for HyperFeed as developers make code changes.
Pros and Cons of Redeye
We have indeed come this far. It is a good time to go back and review the original pain points for hf_regression_tests.
They boil down to:
- Increasing turnaround time: at least around 45 minutes
- Single person use
Here is how Redeye addressed them:
- The average turnaround time is now between 20 to 23 minutes
- Multiple users can run it at the same time
Crucially, we expect the average turnaround time to remain unchanged by virtue of Cluster Autoscaler even if the number of tests increases in the future, as long as Argo can support our growing workflow.
One notable downside of Redeye is that it is currently far less capable of allowing a user to diagnose the test failures in the cloud than hf_regression_tests on-prem. The primary reason is that each PostgreSQL pod will be terminated by Argo as soon as the corresponding 6-step vertial branch has finished. This means that the tables in PostgreSQL such as “flightplans” will cease to exist for the user to run the SQL queries against to understand why some tests failed. To work around this limitation, the user is encouraged to use hf_regression_tests on-prem instead where the user can run a small number of tests quickly and not worry about PostgreSQL being deleted. Therefore, we have a clean separation of responsibilities where Redeye is sort of a sledgehammer that can run all tests faster but is less capable of allowing the user to diagnose individual test failures whereas hf_regression_tests on-prem takes twice as long to process all tests but provides better support for investigating test failures.
Conclusion
In this post, we have looked at how hf_regression_tests works on-prem and described the motivation for migration to the cloud due to its pain points. We have gone through a set of scenarios for Redeye to better understand how it works end-to-end from a Rube Goldberg machine’s perspective. Finally, we have discussed the pros and cons of Redeye and why hf_regression_tests on-prem continues to be useful for us.
Now, the reader may have noticed that we did not discuss any architectural tradeoffs associated with our design of Redeye. For example, we did not provide any rationale behind some of the architectural decisions we made:
- Why are there two auto scaling groups in EKS, one being a spot instance and the rest on-demand instances?
- Why do all provisioned EC2 instances in EKS reside in a single Availability Zone as opposed to multiple Availability Zones?
In a nutshell, these are tactics to satisfy our high priority quality attributes[2] for Redeye. More in-depth discussions on quality attributes, architectural tradeoffs, and what they mean in our context can be a topic for a future blog post
References
1. Zach Conn (2016). Hyperfeed: FlightAware’s parallel flight tracking engine. 23rd Tcl/Tk Conference, Houston, TX.↩2. Len Bass, Paul Clements, and Rick Kazman (2012). Software Architecture in Practice 3rd Edition. Addison-Wesley. ↩