
The summer internship program at FlightAware plays a crucial role in shaping the next generation of technology leaders while contributing fresh energy and perspective to our engineering teams. The internship program not only gives students the opportunity to apply their classroom knowledge in a real-world setting, but it also allows our world class engineers to mentor emerging talent and make an impact on the future of the software industry. Jason Chung, our intern for this summer, had the privilege of working with our Systems crew on an amazing project that leveraged machine learning as a tool to build comprehensive software manifests for a given server in our network. Not only did Jason gain experience building a solution in a real world setting, he gained presentation experience when he presented his project to all of FlightAware Engineering, and career guidance via tech and career development talks presented by FlightAware engineers. I invite you to keep reading to hear from Jason about his experience at FlightAware and the great work that he did! ~ Shawn K.
Jason Chung

Hello! My name is Jason Chung, and I’d like to share my experience as a software engineering intern at FlightAware. I’m currently pursuing a master’s degree in Software Engineering at Carnegie Mellon University and expect to graduate in December 2025. During my internship this summer, I was lucky enough to join the Systems Crew, giving me an opportunity to apply my knowledge, expand my skillset, and gain hands-on experience with new technologies. FlightAware is home to some of the most knowledgeable yet humble professionals I’ve met, and it’s been an honor to both learn from them and contribute to the team.
My Project
For my internship project, I explored how machine learning (ML) could help system administrators understand what kinds of software are running on a given server—and do so in a centralized, intelligent, and automated way.
The next section provides some context by describing a common pain point for system administrators at Flightaware, and explains how my project addresses this issue.
The Problem
Site reliability engineers at FlightAware often need to answer a seemingly simple question: What services are running on a host?
In practice, answering this question is far from trivial. FlightAware operates hundreds of servers—also referred to as hosts, a term commonly used in systems administration to denote any machine connected to a network. Each host serves a specific role, ranging from hosting development environments to storing vast amounts of flight data. These hosts run a variety of software components, commonly referred to as services, which are accessed and relied upon by different teams across the organization.
Understanding which services are running on a host is crucial for timely problem diagnosis and resolution. For example, servers that have active services but are labeled otherwise may cause confusion about whether they should be decommissioned, risking suspension of important but untracked services (and vice versa: not getting rid of inactive servers with inaccurate labels).
These services can include everything from Docker containers and background processes to scheduled jobs and system services. While the purpose of a server (e.g., web server, database server) might hint at its services, the reality is that many servers have a combination of running services that make classification harder. Not only that, but these services can change over time, making it harder to identify them.
Why Existing Solutions Fell Short
At FlightAware, NetBox serves as the source of truth for infrastructure metadata—it tracks things like IP addresses, device roles, rack locations, and custom tags. However, in practice, we primarily use NetBox tags to store salt roles, which define a server’s configuration state but don’t offer a complete picture of the actual services running on that host.
This limited use of tags makes it difficult to quickly understand what a server is doing in production. Manually maintaining accurate service information is time-consuming, error-prone, and often out of sync with the real system state. Worse, many servers don’t have complete or reliable tags at all, which makes tasks like root cause analysis and triaging harder than they should be.
Previously, admins relied on a mix of tools to understand a server’s service set:
- SSHing into each host manually
- For each server:
- List of containerized services
- List of running processes
- Disk usage, file mounts, cron jobs, etc.
- NetBox tags—if they exist and are up-to-date
While these tools were helpful, they produced long, inconsistent, and noisy outputs. Not to mention, manually querying, parsing, and interpreting this data on a regular basis wasn’t an ideal solution by any means.
This challenge is also compounded by scale and velocity: FlightAware manages over 700 servers, and it can take several minutes to manually confirm the status of services depending on their nature. Over the last six months alone, approximately 6,700 changes were made to servers in NetBox—about 225 changes per week (this excludes other changes to hardware and network devices as well). Importantly, each change may require service status confirmation, making manual auditing impractical given the volume and frequency of updates.
Proposed Solution
Imagine if a machine learning model could sift through these lengthy, noisy text outputs, recognize patterns, and accurately predict which services are running on a server. These predictions could then be validated against known configurations and reviewed by humans for accuracy.
This is precisely what my project — the Intelligent Tagging System (ITS) — aims to achieve. By leveraging natural language processing (NLP) and machine learning, ITS automatically classifies services based on data from servers. The project can be broken down into several key objectives:
- Extracting features from text output using natural language processing
- Training machine learning models with the extracted features and existing NetBox data (i.e. existing tags)
- Automatically tagging servers with service labels using predictions from ML models with specific levels of confidence
- Updating and validating tags in a feedback loop, making the system self-improving and up to date over time
Data Collection and Preprocessing
To start, I needed a list of active servers at FlightAware. I obtained this by querying our organization’s NetBox instance through its own NetBox API. Next I built a lightweight tool to automate SSH access to those servers. After gaining access, I collected both structured and semi-structured data from each active server using remote shell commands. These commands focused on three key areas: system metadata, running processes, and application-related files.
Examples of the collected data include:
- Containerized services: docker ps provided information on running and stopped Docker containers, including image names, commands, and statuses.
- Process listings: ps aux and systemctl list-units --type=service gave visibility into system-wide processes and active services. ps -eo pid,cmd and lsof helped trace running executables and their command-line arguments.
- Scheduled jobs: System-wide cron jobs from /etc/cron.* directories, and per-user cron jobs collected via crontab -u.
- Network activity: netstat -tlnp and ss -tuln showed which processes were listening on which ports, helping to infer exposed services.
- System metadata: Commands like uname -a, free -h, df -h, and cat /proc/cpuinfo were used to capture OS version, memory usage, disk space, and CPU model information.
- Configuration and application files: Service-related configuration files were discovered using find /etc -name '*.conf’, and application directories were examined via ls /opt/, /usr/local/, and similar paths.
Each host was also associated with salt roles stored as tags in NetBox. While these roles—used by SaltStack (an excellent and open source automation tool we use for infrastructure administration) to define a server’s intended configuration—were generally accurate, they were often incomplete when it came to identifying all running services. To supplement this, server names and purposes were heuristically mapped to key service labels as well. As a result, the labeling approach was hybrid: combining structured config data with pattern-based inference to generate useful labels for supervised learning.
The outputs were cleaned, normalized, and stored in a lightweight SQLite database. Where applicable, labels were augmented or corrected by hand to ensure quality in the training set.
Feature Extraction (with NLP)
Rather than relying on handcrafted features, I treated system outputs as text documents and used NLP techniques to extract features:
- TF-IDF or (Term Frequency–Inverse Document Frequency): Captures important but uncommon tokens like service names or flags.
- CountVectorizer: Captures frequency of key terms across command outputs.
- word2vec: To capture semantic relationships between similar services or tasks.
This allowed the model to learn patterns from raw outputs, without needing domain-specific knowledge.
Model Training
In our situation where one item can belong to more than one category at the same time—like a server that acts both as a database and as an internal service—using a single-label classification model isn’t enough. Single-label models can only assign one category to each item, so they might incorrectly label a server as just a database or just a service, but never both.
Thus, I decided to use a multi-label classification model, which means the model can assign multiple labels to the same item. This allows it to identify multiple services on a host—such as databases and internally built services—simultaneously.
I tested the following models:
- Multi-output Random Forest: Offers strong performance with high interpretability and robustness to noisy data.
- Gradient Boosting (XGBoost): Handles complex feature interactions well and often yields high accuracy in structured data.
- Logistic Regression with One-vs-Rest (OvR): A simple, lightweight baseline approach where a separate classifier is trained for each label.
To evaluate performance, models were trained on 80% of the labeled servers, while the remaining 20% were held out as a validation set. This form of train/test split is a basic type of cross-validation, helping to estimate how well the model will generalize to unseen data. Cross-validation is important because it helps prevent overfitting—where a model performs well on training data but poorly on new data.
Model Evaluation and Tuning
The models were evaluated using a variety of metrics to capture performance:
- F1-score (macro and micro): To balance precision and recall across both common and rare service labels.
- Accuracy and AUC-ROC: Used where appropriate, though accuracy alone proved misleading (more on that below).
- Confusion matrices: Generated for each service to better understand where predictions were going wrong.
To improve the model's performance, I experimented with different sets of service labels that the models predict to be running on the host systems. The goal was to find a balance between covering a wide range of services while keeping the services simple enough for the model to learn effectively.
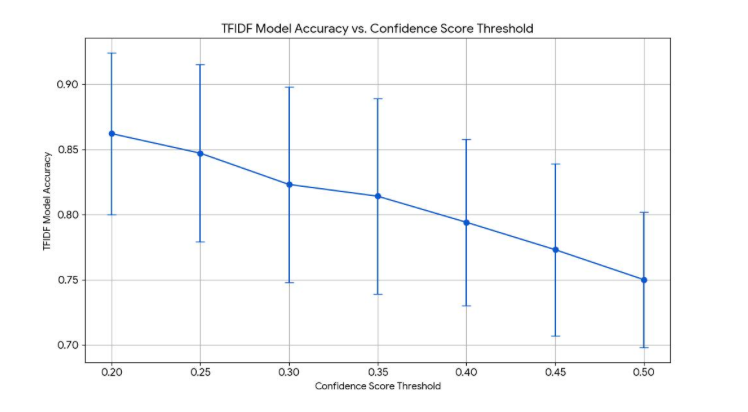
I also used a technique called RandomizedSearchCV, which is a fast way to test different combinations of hyperparameters — the settings that control how the model learns. One important hyperparameter I focused on was theconfidence score threshold — the cutoff the model uses to decide whether it's confident enough to make a prediction for a specific service.
As shown below, changing this threshold had a noticeable effect on the TF-IDF model’s accuracy, which is a model that turns text into numbers based on how important each word is in the dataset.
Challenges
One major challenge I encountered was overfitting, especially when working with a smaller set of labeled data. The model initially performed well on training data but failed to generalize, indicating it was memorizing rather than learning meaningful patterns. To address this, I expanded the dataset with more labeled examples, which helped improve generalization—but then I ran into another issue: the model was reporting suspiciously high accuracy scores, often around 99%.
It turned out that this was due to how I was calculating accuracy—by counting total label predictions, including negatives. Since most labels are negative (i.e., a service is not present on a given server), the model could achieve high accuracy simply by predicting zeros across the board. Once I corrected the metric to focus on correctly predicted positive labels, I saw a much more realistic accuracy of around 85%, which better reflected the model’s true performance. At that point, the model no longer showed signs of overfitting and began to generalize well to new data.
Another challenge was dealing with sparse data. Some services were so rare that the model couldn’t learn any reliable patterns to identify them. These infrequent labels added noise and lowered overall performance, so I removed them from the training set to help the model focus on patterns it could actually learn.
Lastly, I found that default model parameters—especially the confidence threshold for positive predictions—weren’t always appropriate. Initially, the classification threshold was set to 0.5, meaning the model would only predict a service as present if it was more than 50% confident. For certain services, this was too conservative and led to many missed positives. By lowering the threshold, I was able to capture more true positives without introducing too many false positives. This highlighted the importance of evaluating and adjusting default parameters rather than relying on them blindly.
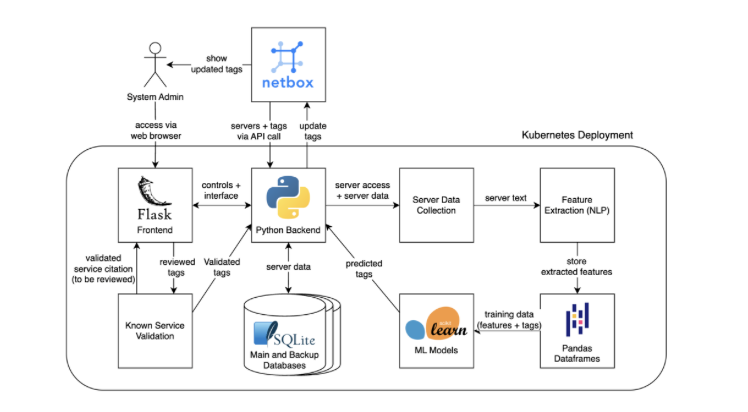
Deployment and Feedback Loop
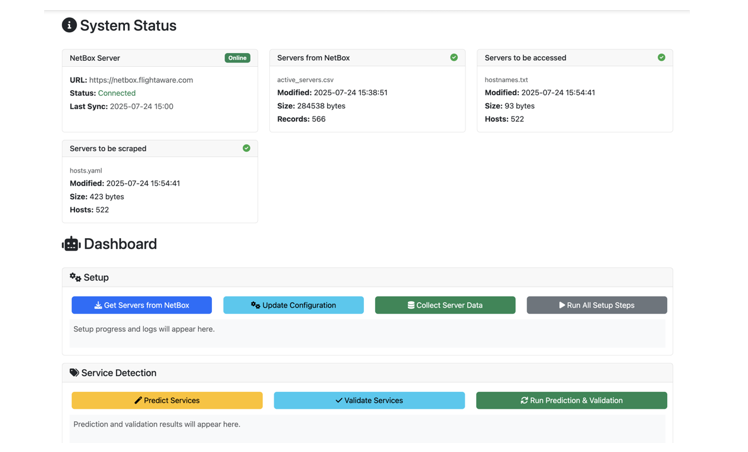
Once the training and prediction pipeline was in place, I built a lightweight Flask frontend to tie everything together. Flask is a lightweight and flexible web framework for Python that makes it easy to build web applications and APIs. Flask is often chosen for projects that need quick development without the overhead of a full-stack framework. It was a perfect fit for what was needed here.. My interface allows users to:
- Monitor the status of the NetBox API connection
- View all active servers and see when each was last queried
- Collect and store system data and service labels from NetBox
- Train machine learning models on the collected dataset
- Push predicted and validated (and human-reviewed) services labels back into NetBox
- Manually review and verify model predictions through a human-in-the-loop validation screen, ensuring service labels are accurate before updating the source of truth
The system forms a self-sustaining feedback loop: it collects data from servers, makes predictions, supports validation (automated or manual), pushes updated tags to NetBox, and continues learning as new patterns emerge.
This architecture enables the following capabilities:
- Kubernetes deployment for scalable and containerized orchestration
- Continuous updates to service labels and periodic retraining of ML models
- Auto-scaling of the application based on usage and demand
- High availability and fault tolerance via managed replicas, with automatic restarts or container replacement to minimize downtime
- Historical tracking of past data snapshots and label configurations for auditing and retraining purposes
Reflection
What’s Next?
While my project sufficiently demonstrated how machine learning could assist in automating service identification, there are still several potential improvements that could be made:
- Explore More Advanced Models: While traditional ML models like Random Forest and Logistic Regression worked well, experimenting with transformer-based models (e.g., BERT) or recurrent neural networks could better capture contextual relationships in command outputs and improve classification, especially for more complicated types of software that are harder to identify.
- Explore Additional Use Cases: Currently, the model focuses solely on identifying services running on each host. However, this approach could be extended to automatically populate other custom fields in NetBox—such as the server’s purpose, environment (e.g., production, staging), or flags for enabling specific monitoring exports like cadvisor_exporter_enabled. Automating the tagging of these additional attributes could further reduce manual effort and improve data consistency.
- Enhance Documentation: Most of the project is well documented, which helps others understand and use the codebase. However, documentation can always be improved—for example, by adding diagrams to visually explain system architecture and workflows. Using “diagrams as code” tools (like Mermaid or PlantUML) to create and maintain diagrams directly alongside code is not a bad idea for the future.
- Improve Software Architecture for Maintainability: The software itself could be cleaner and easier to maintain for future developers. One improvement I could have made is designing the system to be more modular and extensible from the start. Even though I have made clear interfaces with separate concerns—such as data collection, feature extraction, model training, and prediction—they can be broken down even further. This approach would enhance the system’s maintainability and ability to be easily modified over time.
Takeaways and Acknowledgments
This project gave me the opportunity to apply machine learning and software engineering principles to a real-world challenge—one with immediate, practical value to the team. I learned how to design and build scalable, production-friendly systems while balancing experimentation with reliability. Just as importantly, I learned how messy, noisy, and incomplete data often is in the real world, and how critical it is approach problems with an unbiased view and open mind. From designing the initial architecture to deploying a working solution, this internship gave me a glimpse into what it takes to build tools that are not only smart, but actually usable by the engineers they’re meant to support.
I'm truly grateful for the support I received from my mentor Jay, my manager Justin, the Systems Crew, and everyone at FlightAware who made this experience so meaningful. Their guidance, encouragement, and patience helped me grow—not just as an engineer, but as a person. Thanks to them, I can move forward with confidence and excitement for what’s ahead. Thanks for reading!